Your information saved successfully.
Smart Wait Estimates
Increase customer satisfaction with accurate wait time quotes
Waitlist Me uses several methods for suggesting estimating wait times for parties added to the list. The default option is an average wait. This is a rolling average that is recalculated every time a party is marked as served. You can choose a time period to include in this average, from 1 – 24 hours. You can also choose 3 group size ranges to display for these averages. These settings are in the app under the gear icon > Customization > Waitlist View > Wait Estimates.
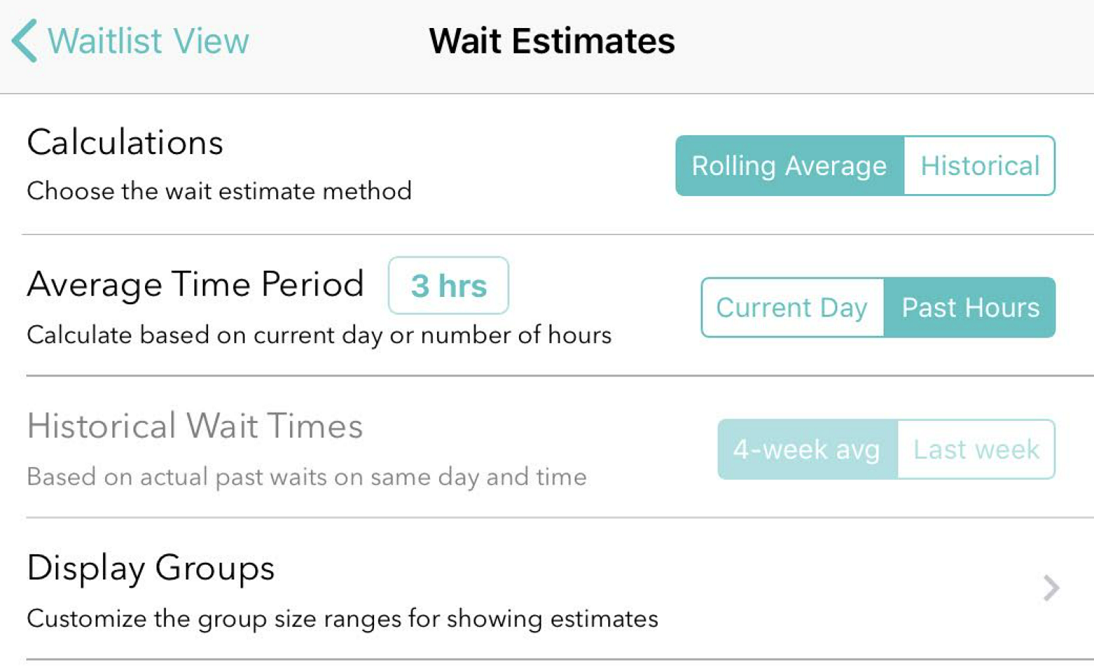
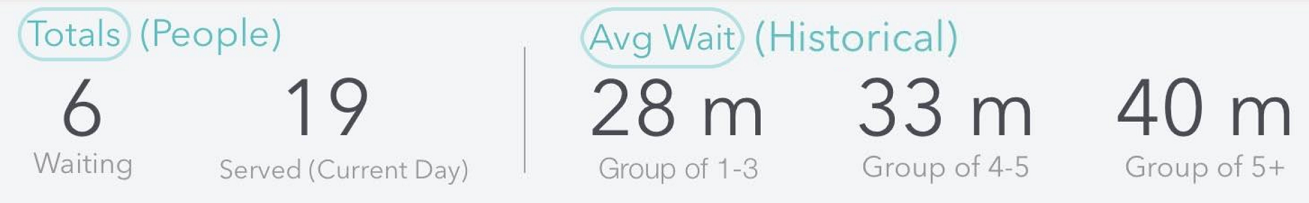
With Pro & Platinum subscriptions, there are advanced features to help you estimate wait times based on party size and time of day. The calculations take into account the previous four weeks of data for parties served. To enable this option, select Historical for the Calculations option from the menu shown above. Then you can access the data any time by pressing on the Totals or Avg Wait buttons from the main waitlist screen.
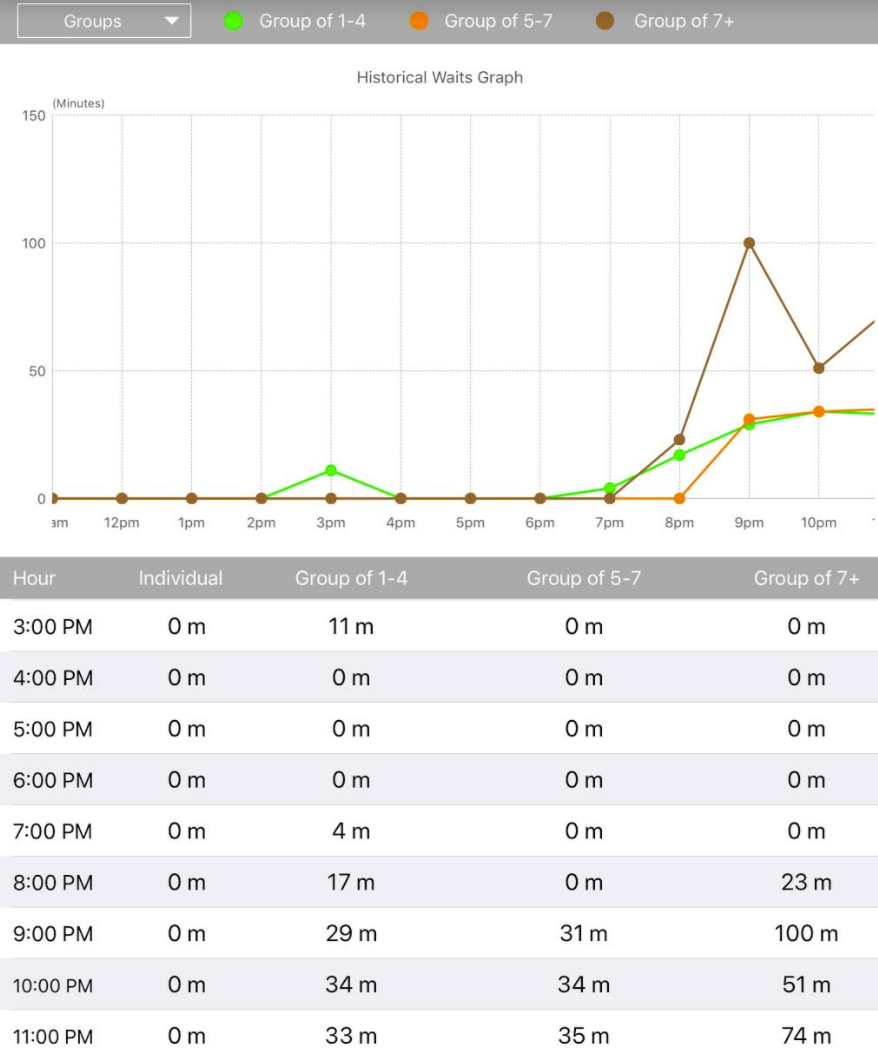
View graphs and charts that average the data for the previous week or four weeks. Use the menus at the top to switch between days of the weeks and various group views. This view shows a breakout of group ranges:
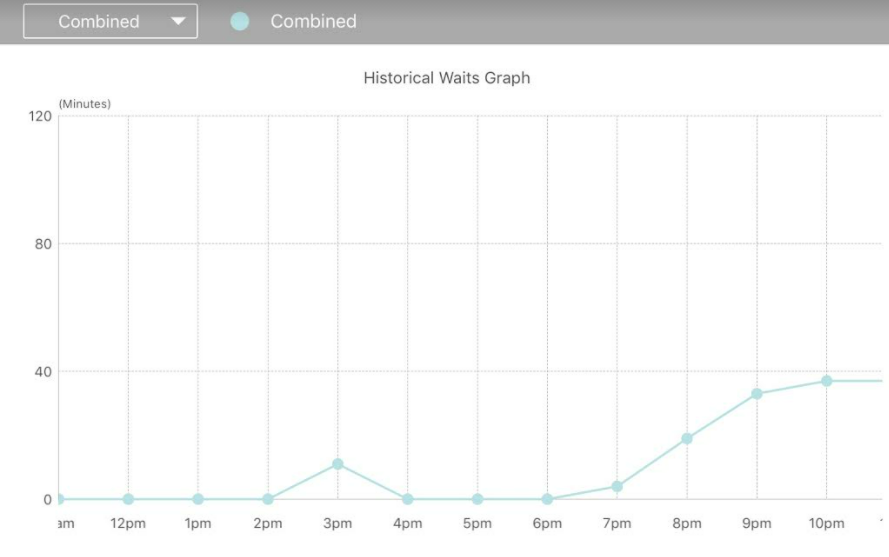
While this view gives a combined estimate that includes all group sizes:
If the data shows that you consistently have waits for specific group sizes, it may be beneficial to remove some of the lesser used tables and add more to accommodate the group sizes that usually wait the longest. These metrics can help you plan future staffing so you can ensure coverage for the busiest times. And of course, you can give smarter estimates to waiting parties, which leads to happier customers.
With Pro & Platinum subscriptions, there are advanced features to help you estimate wait times based on party size and time of day. The calculations take into account the previous four weeks of data for parties served. To enable this option, select Historical for the Calculations option from the menu shown above. Then you can access the data any time by pressing on the Totals or Avg Wait buttons from the main waitlist screen.
View graphs and charts that average the data for the previous week or four weeks. Use the menus at the top to switch between days of the weeks and various group views. This view shows a breakout of group ranges:
While this view gives a combined estimate that includes all group sizes:
If the data shows that you consistently have waits for specific group sizes, it may be beneficial to remove some of the lesser used tables and add more to accommodate the group sizes that usually wait the longest. These metrics can help you plan future staffing so you can ensure coverage for the busiest times. And of course, you can give smarter estimates to waiting parties, which leads to happier customers.